
Performance & Targets
Key measures for the period, compared with the one before, with targets, a 90-day history and a downloadable summary.
What It Does
The Performance page shows your key measures for any date range, set against the period before. Alongside them sit the quality and upkeep tiles: jobs reopened after sign-off, readings outside their limits, assets due for service, forms waiting for a stage and engineer utilisation. Each one links through to the records behind the number.
Set a target on a measure, for example 90% of jobs finished on time, and the tile tells you whether you are on, close to or off target. Open its History to see the last 90 days as a chart. A Jobs finished chart and a breakdown sit underneath, and a summary of the period can be downloaded.
- Compare any period with the one before
- Targets that show on, close or off target
- A 90-day history for each measure
- Quality tiles that link to the records behind them
What It Solves
Without measures, how well the team is doing is a feeling, and a quarterly review is a scramble through exports. Performance gives you the numbers that matter as they stand, shows whether they are moving the right way, and takes you from a worrying figure straight to the jobs causing it.
Works Hand in Hand With
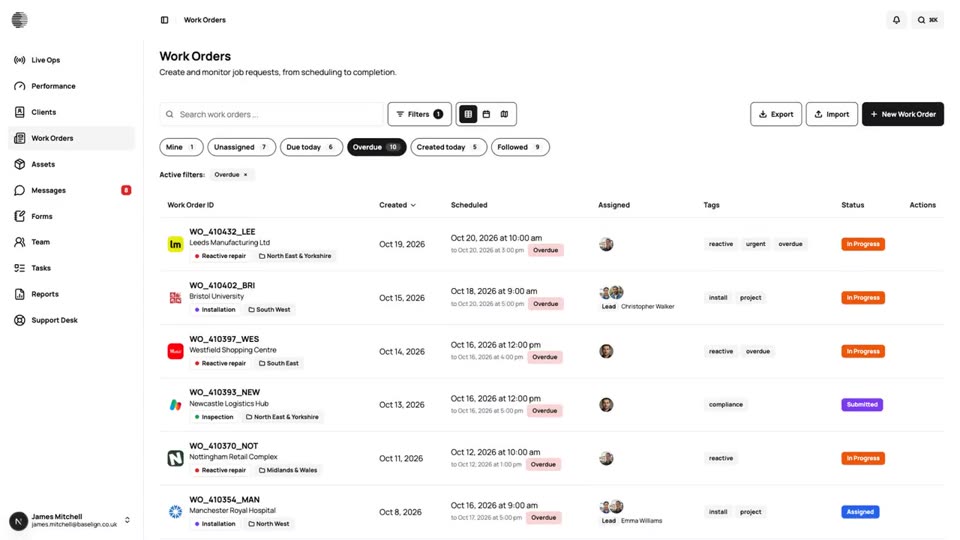
Live Ops
The home page for your operation: what needs attention, what is in progress and who is free, updated live through the day.
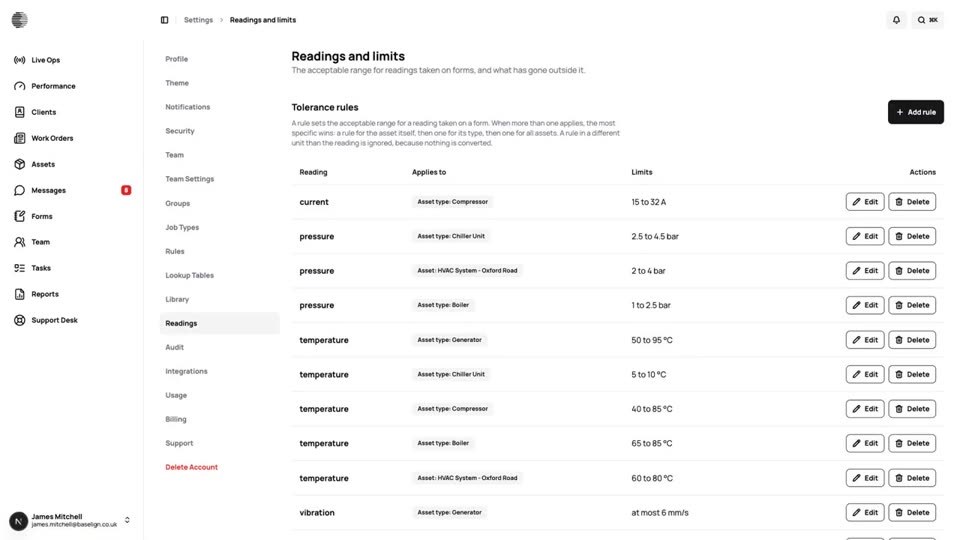
Readings & Tolerance Limits
Record readings such as pressure and temperature against an asset and set limits, so out-of-range values are flagged straight away.
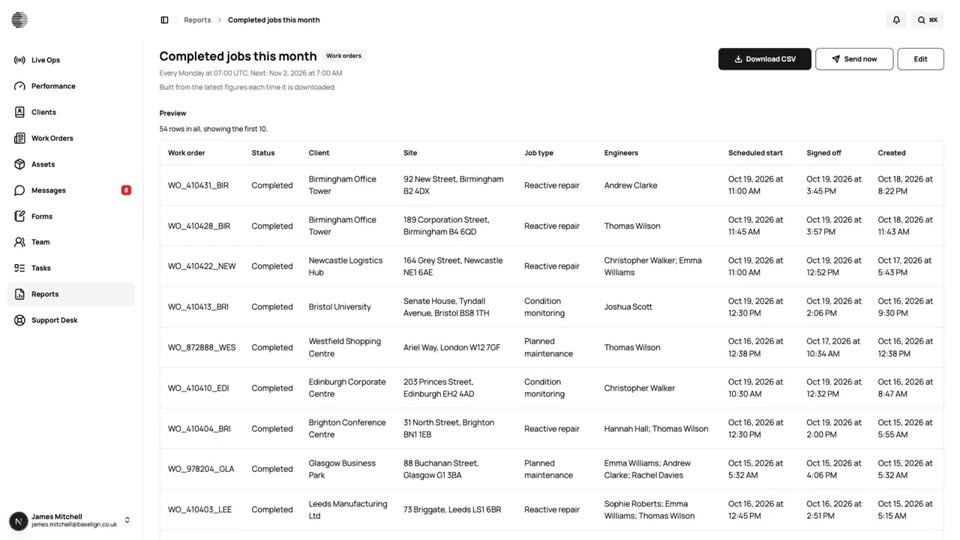
Reports
Build saved reports with the columns and filters you need, schedule them, and send them to your team or your clients.
Try Performance & Targets With Your Own Team.
Start a free trial, or tell us what you need and we'll show you around.